

The Kenyan shilling has spent most of 2026 trading around KES 129 per United States dollar. Barely two years ago, the CBK indicative rate touched KES 160.80, its lowest recorded level, and importers were scrambling to hedge.
The turnaround was sharp: the shilling appreciated 17.4% over 2024, and the 2026 trading range of KES 128.57 to KES 130.29 has been among the tightest in a decade.
This guide breaks down every force behind that move and what comes next.
How Kenya’s exchange rate system works
Kenya operates what economists call a managed float, meaning the shilling’s value is officially determined by supply and demand in the foreign exchange market, but the Central Bank of Kenya can intervene when volatility threatens economic stability.
The distinction matters because it means the USD/KES rate is neither fully market-driven (as the US dollar/euro pair would be) nor pegged to a fixed value (as the Hong Kong dollar is to the US dollar), but sits somewhere in between, with the CBK acting as a stabilizing hand.
The CBK’s primary interventions take three forms. The most direct is buying or selling US dollars from the country’s foreign exchange reserves, which stood at USD 9.3 billion in 2024, equivalent to roughly 4.7 months of import cover, according to Huduma Global’s analysis of CBK data.
Selling dollars into the market increases supply and supports the shilling; buying dollars rebuilds the reserve buffer. The second tool is the Central Bank Rate (CBR), the benchmark lending rate that influences all borrowing costs in the economy and, through interest rate differentials, attracts or repels foreign capital.
The third is open market operations, namely government securities auctions that manage liquidity in the banking system.
Related reading on FinanceTracked:
The CBK’s mandate is anchored to an inflation target of 5% with a tolerance band of ±2.5%, meaning it aims to keep annual consumer price inflation between 2.5% and 7.5%. Exchange rate stability is an explicit secondary objective.
When the two goals conflict (as they did in early 2024, when the shilling was falling and inflation was rising simultaneously), the CBK faces difficult trade-offs, and the market watches closely for signals about which objective takes priority.
As Cytonn Research has documented, the managed float gives the CBK flexibility but also exposes the shilling to global forces that a pegged currency would absorb differently.
Kenya’s choice of a managed float reflects a broader trend across East Africa. It lets the currency adjust to real economic fundamentals over time while giving the central bank room to smooth speculative spikes and panic-driven selloffs that can cause real economic damage in the short term, particularly for a country that imports a large share of its energy and manufactured goods.
The six key drivers of the USD/KES exchange rate
The shilling’s value against the dollar reflects multiple forces operating at different speeds: some structural and slow-moving, others that can shift the rate in a single trading session.
The six drivers below account for most USD/KES movement, and understanding how they interact is key to reading the pair.
| Driver | How It Affects the Shilling | Current Status (Sep 2026) |
| Trade balance | Net imports create structural dollar demand, weakening the shilling | Tea exports at record KES 186.9B; import costs rising on Red Sea disruptions |
| Diaspora remittances | Dollar inflows from abroad boost supply, supporting the shilling | Record $5.04B in 2025; Jan–May 2026 down 1.4% YoY |
| CBK monetary policy | Higher rates attract foreign capital; lower rates encourage borrowing | CBR held at 8.75% for three consecutive meetings |
| Government debt | Repayments spike dollar demand; new borrowing initially adds supply | 2024 Eurobond refinanced; no major maturities imminent |
| Foreign investment | Inflows strengthen the shilling; capital flight weakens it | GDP growth 5.3% in Q1 2026; private credit up 10.2% |
| Global dollar strength | A stronger dollar pushes USD/KES higher even without domestic changes | DXY at ~100; moderate pressure |
Table: Six key USD/KES drivers and their current status. Sources: CBK, Tea Board of Kenya, Kenyan WallStreet, Trading Economics.
Trade balance and import demand
Kenya is a net importer, spending more on inbound goods, particularly petroleum, machinery, and manufactured products, than it earns from its major exports of tea, coffee, and horticultural products.
That persistent current account deficit creates baseline demand for US dollars in the Kenyan forex market, putting structural depreciation pressure on the shilling over time.
When global crude oil prices rise, the effect amplifies because Kenya’s energy import bill swells and importers need more dollars to pay for it, according to analysis from Cytonn Research.
On the export side, the picture has been strengthening. Tea export earnings rose to KES 186.9 billion ($1.44 billion) in 2025, up from KES 181.6 billion in 2024, according to Tea Board of Kenya data reported by Streamlinefeed and Reuters.
Meanwhile, horticulture (cut flowers, vegetables, and fruits exported primarily to European markets) has emerged as the fastest-growing export category, with a value compound annual growth rate (CAGR) of 9.57% and total agricultural export earnings reaching a record KES 387.6 billion in 2024, as LeadAfrik’s 26-year analysis of CBK data documented.
Those export revenues bring foreign currency into the economy and partially offset the structural import-driven dollar demand.
The Middle East conflict has introduced a new complication in 2026: shipping disruptions through the Red Sea have raised freight and logistics costs, and a Reuters report published by CNBC Africa noted that roughly eight million kilograms of tea sat stranded in warehouses in Kenya’s port city of Mombasa in early 2026 because of those disruptions. Higher transportation costs eat directly into export competitiveness and widen the trade gap.
Diaspora remittances
Diaspora remittances have quietly become Kenya’s single largest source of foreign exchange, overtaking tea, coffee, and tourism revenue combined.
Kenyan Wallstreet reported that formal remittance inflows climbed to a record USD 5.04 billion (KES 650.16 billion) in 2025, crossing the $5 billion threshold for the first time and marking a 1.9% year-on-year increase from USD 4.95 billion in 2024.
The growth extends a two-decade expansion that has lifted annual remittances nearly 15-fold since 2004, with only 2009 recording a contraction.
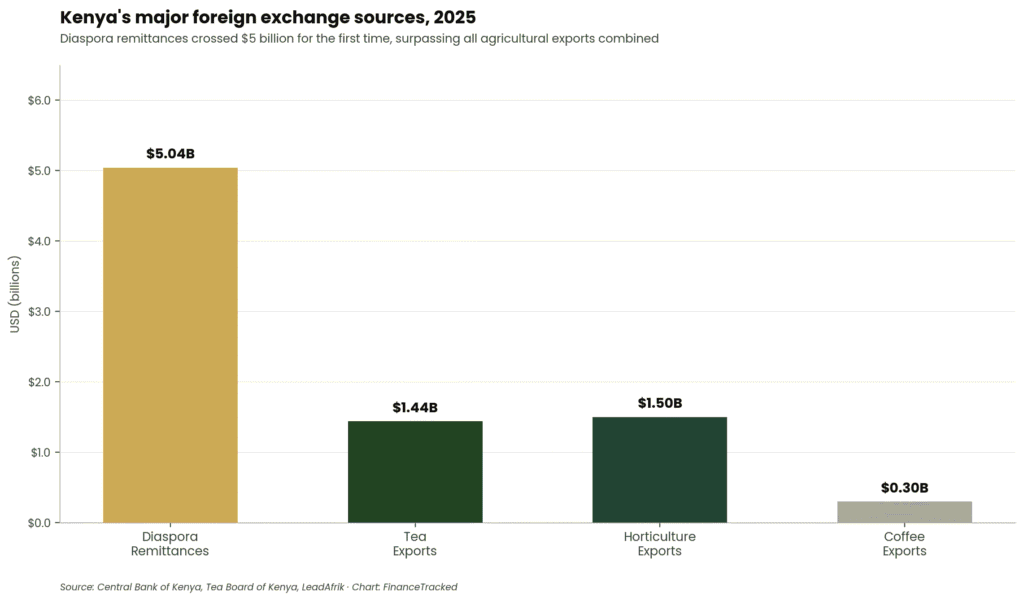
Diaspora remittances surpassed all of Kenya’s major agricultural exports combined in 2025, cementing the diaspora as the country’s most important source of foreign currency.
The United States is the dominant source, contributing $2.73 billion (54.2% of total flows) in 2025, according to Huduma Global’s diaspora analysis.
The United Kingdom follows with approximately $360 million, and the Gulf states (Saudi Arabia, the United Arab Emirates (UAE), and Qatar) account for a significant share of the remainder.
When Kenyans abroad convert dollars, pounds, or riyals into shillings, they increase the supply of foreign currency in Kenya’s forex market, which supports the shilling’s value.
The picture has turned more cautious in 2026, however. Kenyan Wallstreet’s analysis of CBK data showed that cumulative January-to-May remittances slipped to USD 2.07 billion, down 1.4% from USD 2.10 billion over the same period in 2025, the first year-to-date decline on record.
May inflows of USD 394.20 million were down 10.4% year-on-year, marking the second consecutive monthly decline. The slowdown has been attributed to the compounding effects of the Middle East conflict and labor market disruptions in Saudi Arabia, which has historically been a major employer of Kenyan workers abroad.
A separate survey released in June 2026 by the Kenya National Bureau of Statistics (KNBS), the CBK, and Financial Sector Deepening Kenya (FSD Kenya) found that, including informal transfer channels including cash carried by travelers, hawala networks, and mobile money, total diaspora inflows to Kenyan households reached KES 931.8 billion in the 12 months to May 2025, roughly 43% larger than the CBK’s formal remittance figure of KES 651.2 billion.
The gap suggests the shilling receives even more foreign currency support from the diaspora than headline numbers imply.
Kenya’s evolving fintech landscape, including proposed legislation that could open M-PESA data to fintechs, may further formalize these informal transfer channels and bring a larger share of diaspora flows into the CBK’s official tally.
Central Bank of Kenya monetary policy
The CBK’s benchmark interest rate, the Central Bank Rate (CBR), influences the shilling primarily through interest rate differentials.
When Kenyan rates are high relative to US rates, foreign investors are incentivized to park capital in Kenyan government securities to capture the yield advantage, which requires them to buy shillings and supports the exchange rate. When the differential narrows, that incentive weakens, and capital can flow out.
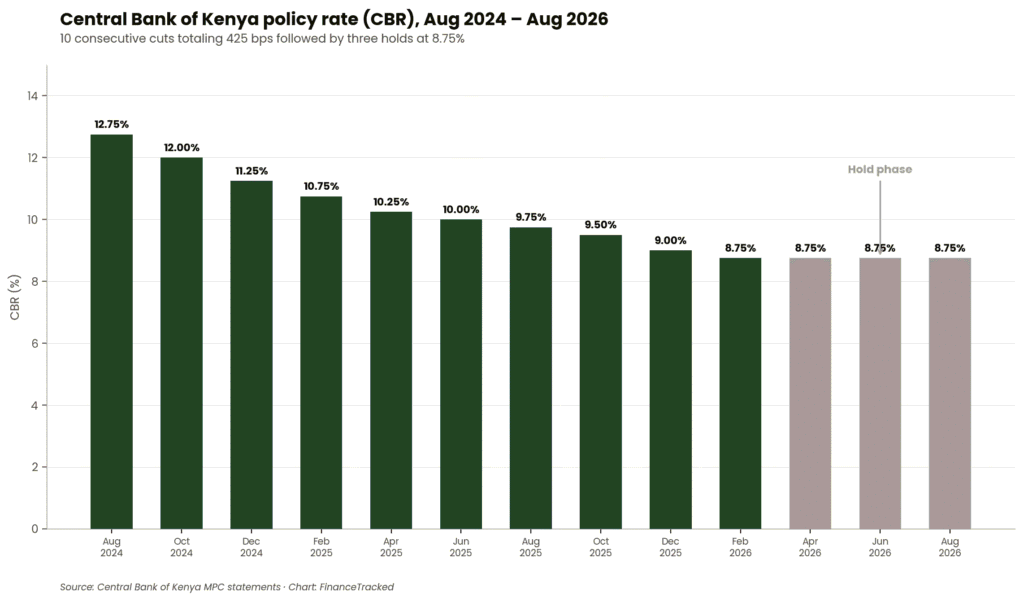
The CBK executed 10 consecutive rate cuts totaling 425 basis points before switching to a hold stance in April 2026, keeping the CBR at 8.75% through August.
The recent policy trajectory tells a clear story: the CBK cut the CBR 10 consecutive times between August 2024 and February 2026, bringing it down by a cumulative 425 basis points from 12.75% to 8.75%, according to Focus Economics.
It then held steady at 8.75% across three consecutive meetings in April, June, and August 2026. The August 2026 MPC statement cited uncertainty from the Middle East conflict as the main reason for the pause, noting that headline inflation rose to 6.5% in July but remained within the 2.5%–7.5% target band.
The hold reflects a balancing act. On one hand, the CBK wants to support private sector credit growth, which stood at a healthy 10.2% in July 2026, by keeping borrowing costs manageable.
On the other hand, it must ensure further rate cuts do not push inflation above the target ceiling or narrow the interest-rate differential with the United States enough to prompt capital outflows.
Kenya is not alone in navigating this tension; Nigeria’s central bank saw bank deposits surge after its own rate reset, illustrating how rate decisions ripple through banking systems across Africa.
As the East African Herald reported, the CBK projects Kenya’s economy to grow 4.9% in 2026 and 5.3% in 2027, but acknowledged that the Middle East conflict, global trade uncertainty, and potential El Niño effects all pose downside risks. The next MPC meeting is scheduled for October 7, 2026.
Government debt and sovereign risk
Kenya’s external debt obligations create periodic spikes in dollar demand when large repayments come due, and the shilling’s 2023–2024 crisis illustrated this dynamic in its starkest form.
As Huduma Global documented, the looming maturity of a $2 billion Eurobond in June 2024 was a primary driver of the shilling’s slide to a CBK indicative rate low of KES 160.80 in January 2024 because markets were pricing in the risk that Kenya might struggle to raise the foreign currency needed for repayment, which triggered a self-reinforcing selloff.
The resolution was equally dramatic. Kenya successfully refinanced the maturing Eurobond by issuing new bonds in February 2024, eliminating immediate foreign-currency repayment pressure. That single event transformed market sentiment and triggered the sharp 17.4% appreciation that followed.
The episode underscores a broader principle: sovereign credit risk and investor confidence in Kenya’s fiscal management directly affect portfolio flows, and by extension, the exchange rate.
Ongoing government borrowing from international markets can initially strengthen the shilling (foreign currency enters the economy when bonds are sold), but it creates future repayment obligations that will reverse the flow.
Foreign direct investment and portfolio flows
When foreign investors buy Kenyan assets, whether equities on the Nairobi Securities Exchange, government bonds, or direct stakes in infrastructure and business projects, they convert foreign currency into shillings, which increases demand for the local currency and supports the exchange rate.
Kenya’s macroeconomic trajectory has broadly supported these flows: the economy grew 5.3% year-on-year in the first quarter of 2026, up from 4.9% in the same period of 2025, according to CBK and KNBS data reported by Focus Economics.
Political stability and regulatory predictability are essential ingredients for sustaining these inflows. Kenya’s 2017 election, which the Supreme Court nullified and which was followed by a contested rerun, triggered significant currency volatility as investors pulled capital until the political picture clarified, as xTransfer’s analysis noted.
Capital flight (investors selling Kenyan assets and converting shillings back into dollars or other hard currencies) has the reverse effect, increasing dollar demand and weakening the shilling.
The cycle is self-reinforcing: a weakening shilling reduces the dollar-denominated return on Kenyan assets, which can trigger further outflows.
The return of frontier market capital is a pan-African trend; Nigeria’s stock exchange recently regained its FTSE frontier market status after a three-year absence, a move that could redirect some portfolio flows across the continent and indirectly affect how global investors weigh Kenyan assets.
Global dollar strength: The DXY factor
Because USD/KES is a dollar-denominated pair, the shilling’s performance partly depends on how the US dollar behaves against other global currencies.
A rising US Dollar Index (DXY), which measures the greenback against a basket of six major currencies, means the dollar is strengthening broadly, and that typically pushes USD/KES higher even if nothing has changed inside Kenya.
The mechanism works through commodity prices (a stronger dollar makes dollar-priced oil more expensive for Kenya), through trade competitiveness, and through global risk appetite (investors tend to flee to the dollar during uncertainty).
The effect was clearly visible in Q1 2020, when the dollar appreciated 6.8% against other global currencies during the initial COVID-19 shock, and the shilling depreciated alongside virtually every other emerging-market currency even as the pandemic’s direct economic impact on Kenya was still emerging, as Cytonn Research documented at the time.
US economic data releases, including non-farm payrolls, Consumer Price Index (CPI) prints, and Federal Reserve interest rate decisions, can all move USD/KES through this global dollar channel, making them relevant data points for anyone tracking the pair.
USD/KES historical performance: A timeline
The shilling’s long-term trajectory against the dollar shows persistent depreciation, punctuated by crisis episodes and occasional sharp recoveries. The chart below traces annual average rates from 2014 to 2026, with key events annotated.
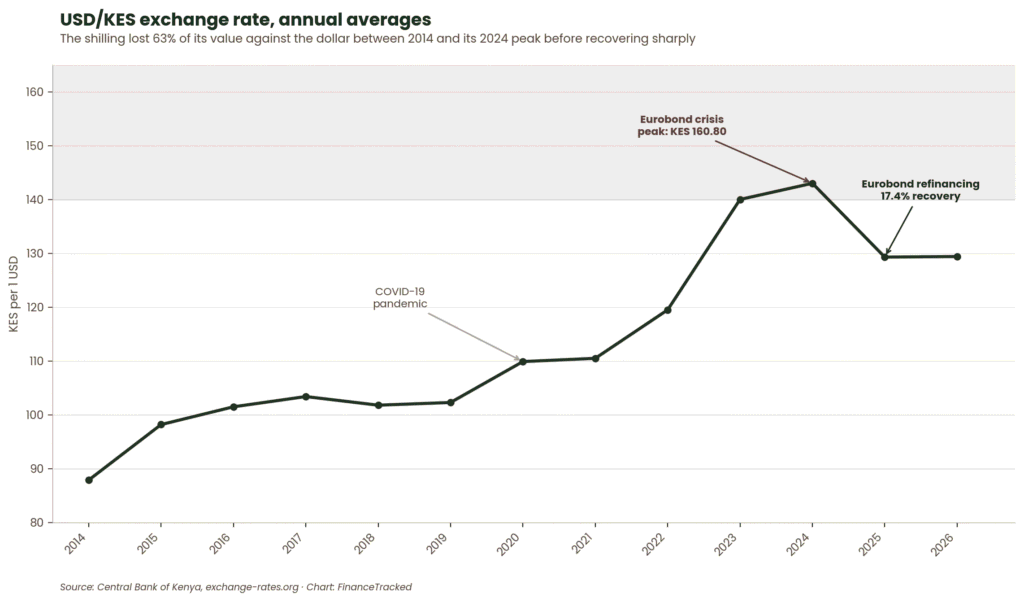
The shilling lost more than 60% of its value against the dollar between 2014 and the January 2024 peak, before the Eurobond refinancing triggered a sharp recovery to the KES 129 range, where it has traded since.
| Period | USD/KES Range | Key Events |
| 1963–1990s | KES 7 → ~50 | Post-independence peg at KES 7–8; gradual depreciation after exchange rate liberalization in the early 1990s |
| 2004–2013 | KES 80 → 87 | 10-year CAGR of 3.7% depreciation; 2011 inflation crisis (19%) triggered a sharp shilling sell-off |
| 2020 | KES 101 → 110 | COVID-19 pandemic drove 8.4% depreciation; global dollar strength added pressure |
| 2021–Jan 2024 | KES 110 → 160.80 (CBK indicative) | Accelerating depreciation driven by rising US rates, high oil prices, and Eurobond maturity pressure; CBK indicative rate low hit in Jan 2024 |
| Feb 2024–Present | KES 160 → 129 | 17.4% appreciation after Eurobond refinancing; reserves rebuilt to $9.3B; rate stabilized at 128–130 through 2026 |
Table: Key milestones in USD/KES history. Sources: CBK, Cytonn Research, Huduma Global, exchange-rates.org.
How the Middle East conflict is reshaping USD/KES in 2026
The ongoing Middle East conflict has emerged as the dominant external risk factor for the Kenyan shilling in 2026, affecting nearly every driver discussed above.
Shipping route disruptions through the Red Sea corridor have raised freight and logistics costs for Kenyan importers, pushing up the cost of bringing goods into the country and widening the trade deficit.
On the export side, those same disruptions have stranded agricultural commodities at port. a Reuters report published by CNBC Africa noted that roughly eight million kilograms of tea sat in Mombasa warehouses in early 2026 because of shipping delays, threatening future export earnings and the foreign currency they bring in.
Higher global energy prices linked to the conflict are feeding through to domestic inflation, which rose from 4.3% in February 2026 to 6.5% by July, according to the CBK’s August 2026 MPC statement.
That inflation trajectory is the central reason the CBK has held rates steady rather than continuing its cutting cycle, and further rate cuts could push inflation above the 7.5% ceiling and weaken the shilling by narrowing the interest rate differential with the United States.
Perhaps most significantly for the exchange rate, the conflict is disrupting diaspora remittance flows from the Gulf region. Saudi Arabia’s labor market shifts, compounded by the broader regional instability, have contributed to the 1.4% year-to-date decline in formal remittances through May 2026, as Kenyan Wallstreet documented.
Given that remittances are the country’s largest single source of foreign currency, even a modest sustained decline feeds directly into the supply-demand balance in the forex market.
The CBK has acknowledged the severity of these risks. Its August statement projected global economic growth slowing to 3% in 2026, down from 3.5% in 2025, and global inflation rising to 4.7% from 4.1%, both projections shaped heavily by the Middle East situation, as the East African Herald reported.
For USD/KES watchers, the conflict is the variable most likely to push the rate out of its current narrow band.
How to track and interpret USD/KES movements
Monitoring the USD/KES rate effectively requires knowing where to find reliable data and which scheduled releases have the most potential to move the pair.
The Central Bank of Kenya publishes daily indicative exchange rates on its website, and these serve as the baseline reference for the Kenyan forex market.
Bloomberg’s USDKES:CUR quote, Trading Economics, and Investing.com’s USD/KES page all provide real-time and historical data with charting tools.
One important distinction to understand is the difference between the CBK’s indicative mid-rate and the commercial rates quoted by banks and forex bureaus.
The indicative rate is a reference point, and actual conversion rates include a spread above and below the mid-rate; that spread varies by institution, transaction size, and whether the conversion is for cash, electronic transfer, or commercial settlement. Diaspora senders and businesses should compare rates across providers, as the spread can differ meaningfully.
The scheduled releases that move USD/KES most reliably are the CBK Monetary Policy Committee decisions (published every two months; the next meeting is October 7, 2026), monthly inflation data from the Kenya National Bureau of Statistics (KNBS), monthly diaspora remittance figures published by the CBK, and quarterly trade balance data.
A rising USD/KES number means the shilling is weakening (more shillings are needed to buy one dollar), while a falling number means the shilling is strengthening.
For businesses and diaspora senders making significant conversions, transaction timing relative to these data releases and global events (a Federal Reserve decision, an oil price spike, or a major Eurobond maturity) can meaningfully affect the rate received.
This does not mean trying to time the market, but it does mean being aware that rates on the day after an MPC meeting or a remittance data release may look different from the day before.
What’s next for the Kenyan shilling
The near-term outlook for USD/KES is one of continued stability with asymmetric risks. More factors could push the rate higher (weaken the shilling) than lower, but the base case remains a tight trading range.
Trading Economics forecasts the shilling at KES 129.95 per dollar by the end of Q3 2026 and KES 129.40 in 12 months, an essentially flat trajectory that reflects a consensus expectation of stability barring external shocks.
The risks to that baseline tilt the shilling to the downside. A prolonged Middle East conflict could push global energy costs and Kenyan inflation materially higher, forcing the CBK to choose between defending the inflation target (which might require rate hikes that slow growth) and supporting economic activity (which might mean tolerating higher inflation and a weaker shilling).
Further declines in Gulf-sourced diaspora remittances would reduce the foreign currency supply that has been the shilling’s strongest support pillar, and potential El Niño effects on agricultural output could weigh on export earnings.
Structural tailwinds partially offset those risks. Kenya’s GDP growth trajectory (5.3% in Q1 2026) remains among the strongest in East Africa, and ongoing agricultural export reforms are producing results, with tea earnings at record levels and horticulture’s share of total exports continuing to rise.
The government’s 2025–2030 Diaspora Investment Strategy, managed by the State Department for Diaspora Affairs, aims to channel more remittances into productive investments through diaspora bonds, streamlined property purchase processes, and diaspora-specific financial products, measures that could deepen and stabilize the forex support that remittances provide.
Looking further ahead, Kenya’s participation in the African Continental Free Trade Area (AfCFTA) and the East African Community (EAC) could increase demand for the shilling through expanded regional trade, and the CBK’s ongoing exploration of a Central Bank Digital Currency (CBDC), a digital Kenyan shilling, could eventually change how the currency is held and transferred across borders, as Chweya’s analysis noted.
The next major catalyst for USD/KES is the CBK MPC meeting on October 7, 2026, where the committee will weigh the latest inflation data against the slowing global backdrop to decide whether 8.75% remains the right rate, or whether the shilling’s calm spell is about to face a new test.
Bottom line
According to Central Bank of Kenya data and its August 2026 Monetary Policy Committee statement, the shilling’s stability around KES 129 per dollar reflects a deliberate balancing act: 10 consecutive rate cuts followed by three consecutive holds have kept private sector credit growing at 10.2% while anchoring inflation within the 2.5%–7.5% target band.
Diaspora remittances remain the country’s largest single source of foreign exchange at over $5 billion annually, though their 1.4% year-to-date decline in 2026 signals that the Gulf conflict’s labor market effects bear close monitoring through the rest of the year.
The October 7 MPC meeting and the trajectory of Middle East-driven inflation represent the most immediate decision points for anyone with exposure to the pair.