
Apple is closing in on a $5 trillion market capitalization, a threshold no public company has crossed before. The stock trades near $340 per share as of September 2026 and commands roughly 6.3% of the S&P 500’s total weight as of March 2026, making it a defining position in virtually every equity portfolio.
Six interconnected financial engines drive the investment case: iPhone revenue, Services, the installed base, buybacks, margins, and the valuation multiple. Understanding how they compound together is the difference between owning Apple stock and understanding what you hold.
iPhone revenue still sets the tone for Apple stock
The iPhone generated $209.6 billion in net sales during Apple’s fiscal year 2025, which ended September 27, 2025, representing 50.4% of the company’s $416.2 billion in total revenue, according to Apple’s fiscal 2025 Form 10-K.
That share has hovered between 49% and 53% for the past four fiscal years, which means iPhone remains the single largest revenue line despite the growing narrative around Services.
The iPhone 17 series, launched in September 2025, accelerated the revenue trend into fiscal 2026 with unprecedented demand across every geographic segment.
Apple reported $85.3 billion in iPhone revenue during the fiscal first quarter of 2026, ended December 27, 2025, up from $69.1 billion in the prior-year quarter, setting an all-time quarterly record for the segment, according to the company’s Q1 FY2026 earnings release.
Table 1: iPhone revenue by fiscal year (source: Apple 10-K filings)
| Fiscal Year | iPhone Revenue | % of Total | Y/Y Growth |
| FY 2022 | $205.5B | 52.1% | +7.0% |
| FY 2023 | $200.6B | 52.3% | -2.4% |
| FY 2024 | $201.2B | 51.5% | +0.3% |
| FY 2025 | $209.6B | 50.4% | +4.2% |
More on FinanceTracked:
- Buffett seals the end of an era at Berkshire
- Airtel Africa snaps up 1.7m of its own shares
- Novo Nordisk stock falls as 2026 plan targets peer growth
ASP growth and the Pro model mix shift
Average selling price (ASP) growth has been a larger contributor to iPhone revenue expansion than unit shipment growth for several consecutive years now.
Apple does not disclose unit sales, but its emphasis on Pro and Pro Max models, and the introduction of a foldable iPhone priced above $1,999 has pushed ASP higher even as global smartphone shipment growth has flattened.
The fiscal 2025 10-K specifically attributed the iPhone revenue increase to higher net sales of Pro models, confirming that mix shift toward premium tiers is a deliberate pricing strategy rather than an accident of demand patterns.
By the fiscal third quarter ended June 27, 2026, iPhone revenue reached $54.25 billion, a 21.7% year-over-year increase that set a new June-quarter record, according to Apple’s Q3 FY2026 press release.
The segment grew 4% year over year in fiscal 2025, a modest headline number that understates the real dynamics underneath a product line still generating more than half of the company’s total sales.
Geographic exposure and upgrade cycle dynamics
Greater China accounts for roughly 17% of total Apple revenue and represents the company’s second-largest market after the Americas, making it both a growth opportunity and a geopolitical risk factor.
China revenue declined in fiscal 2025 due to lower iPhone sales, the 10-K disclosed, though stronger Mac performance partially offset the weakness.
India has emerged as an offsetting growth vector, but the revenue base there remains too small to fully compensate for any sustained downturn in Chinese consumer spending on Apple hardware.
Upgrade cycle dynamics feed directly into Wall Street’s forward estimates for the iPhone segment. Apple Intelligence, the company’s on-device artificial intelligence (AI) suite introduced alongside the iPhone 17 family and significantly expanded with a rebuilt Siri debuting on the iPhone 18 lineup, has given consumers a feature-level reason to upgrade that hardware specifications alone have not provided in recent cycles.
Management guided for mid-teens year-over-year iPhone growth in the September 2026 quarter, according to the Q3 FY2026 earnings call, suggesting the current upgrade cycle has more runway than the market initially expected.
Apple Services is the margin story Wall Street is pricing in
Services revenue reached $109.2 billion in fiscal 2025, crossing the $100 billion annual threshold for the first time and growing 14% year over year, according to Apple’s fiscal 2025 10-K.
The segment includes the App Store, iCloud storage, Apple Music, Apple TV+, AppleCare extended warranties, Apple Pay, advertising revenue, and licensing fees, including a significant payment from Google for default search placement on Apple devices.
Services is now larger than Mac, iPad, and Wearables combined, and the segment’s quarterly run rate exceeded $30 billion in the most recent quarter.
Apple’s Chief Financial Officer (CFO) Kevan Parekh addressed the durability of the Services growth trajectory during the Q3 FY2026 earnings call on July 30, 2026, stating that the company was “very pleased with our record business performance during the quarter, which set new June quarter records for both EPS and operating cash flow.”
He added that the installed base of active devices “reached a new all-time high across all major product categories and geographic segments,” which matters because every new device in the installed base is a potential Services subscriber.
The Google search deal and regulatory risk
The Google search licensing arrangement is the single most consequential line item within Services that Apple does not break out separately in its public filings.
Google pays Apple approximately $20 billion annually for default search engine placement across iPhone, iPad, and Mac, according to figures disclosed during the U.S. Department of Justice (DOJ) antitrust case against Google.
A federal court ruled in August 2024 that Google held a monopoly in search, and the September 2025 remedies decision barred Google from entering exclusive search distribution contracts going forward while allowing the payments themselves to continue, according to MacRumors’ coverage of the ruling.
The judge noted that cutting off payments from Google would impose substantial downstream harms on distribution partners and consumers, preserving a critical revenue stream for Apple’s Services margin profile.
Any future change to the arrangement, whether through appeal, renegotiation, or legislative action, would directly affect the highest-margin segment in Apple’s income statement.
Subscription stacking and revenue per user
The subscription stacking thesis is central to understanding why analysts assign a premium valuation to Apple’s Services segment relative to standalone software companies.
Apple disclosed 1.5 billion paid subscriptions across its platform as of the fiscal third quarter of 2026, and paid subscriptions per Apple ID have been rising steadily as the company bundles services through Apple One and expands its content offerings.
The metric that matters most for long-term Services revenue growth is not the total subscriber count but the average revenue per user (ARPU) across the installed base, because higher attach rates per device translate directly into recurring revenue that compounds against a growing denominator.
Services contributed roughly 42% of Apple’s total gross profit in fiscal 2025 despite generating only 26% of total revenue, a ratio that underscores how heavily the company’s profit architecture has tilted toward its recurring revenue engine, according to the FY2025 10-K gross margin disclosures.
The installed base is Apple’s compounding asset
Apple’s installed base of active devices surpassed 2.5 billion globally as of the fiscal first quarter of 2026, ended December 27, 2025, up 150 million devices from the prior year, according to the company’s Q1 FY2026 SEC filing.
Chief Executive Officer (CEO) Tim Cook described it as “a testament to incredible customer satisfaction for the very best products and services in the world” during the earnings call that accompanied the release.
Apple first began disclosing installed base figures around 2016, when the number stood at roughly one billion devices, and the metric has since become the most-cited figure on quarterly earnings calls because it anchors the entire Services revenue model
By the fiscal third quarter of 2026, Apple confirmed that its installed base had again reached a new all-time high across all major product categories and geographic segments, according to Apple’s Q3 FY2026 press release.
From unit count to revenue multiplier
The installed base functions as a revenue multiplier rather than a simple unit count, because each active device generates recurring Services revenue through subscriptions, app purchases, cloud storage, and advertising exposure.
A traditional hardware company books revenue once when a device ships, and the economics of that transaction end at the point of sale.
Apple’s model is structurally different because every iPhone, iPad, Mac, and Apple Watch sold creates a customer who can generate Services revenue for years after the initial hardware purchase, making the installed base a compounding financial asset rather than a static measure of market penetration.
Wall Street’s modeling approach for Apple has shifted from forecasting unit shipments toward estimating lifetime value per user across the installed base, a framework that treats each device not as a terminal revenue event but as the beginning of a multi-year customer relationship.
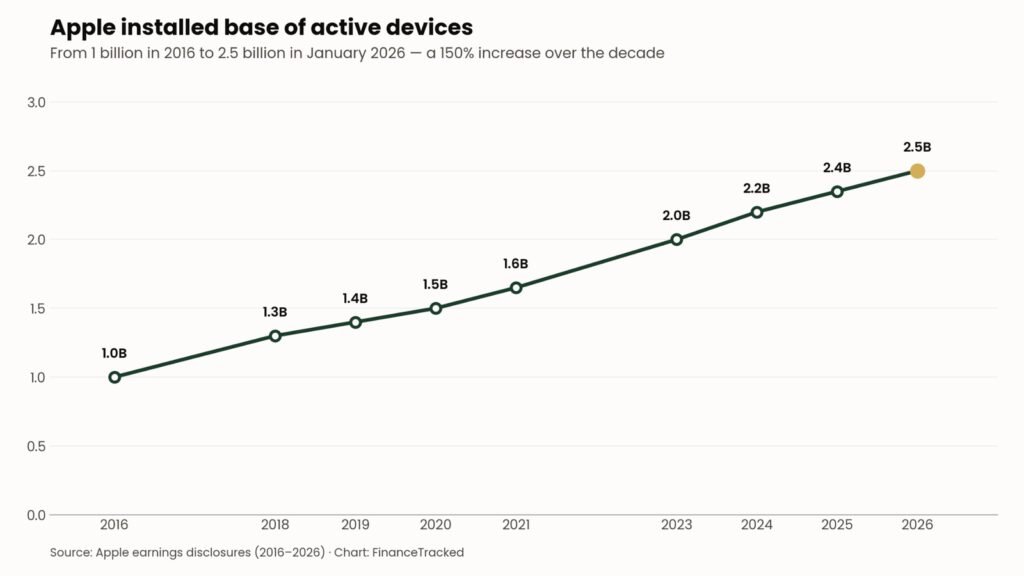
Apple’s installed base has grown 150% over a decade, anchoring the Services revenue flywheel.
Ecosystem lock-in and regulatory pressure
Ecosystem lock-in mechanics reinforce that compounding effect by raising switching costs for users embedded in Apple’s platform of interconnected products and services.
iMessage exclusivity among Apple devices, seamless pairing between Apple Watch and iPhone, AirDrop file sharing, and deep integration across macOS and iOS create friction that makes leaving the ecosystem more costly than staying.
The European Union’s (EU) Digital Markets Act (DMA) has begun to test this moat by requiring Apple to allow third-party app stores and alternative browser engines on iOS.
Separately, the company absorbed a 500 million euro fine for anti-steering violations related to music-streaming app developers, imposed by the European Commission under EU competition law, according to Apple’s Q3 FY2026 10-Q filing.
The extent to which regulatory action in Europe weakens ecosystem retention rates will be a key variable for installed base growth over the next several years.
Buybacks and capital return make Apple a different kind of compounder
Apple has returned more than $1 trillion to shareholders since initiating its capital return program in 2012, with approximately $877 billion of that total coming through share repurchases, according to a Motley Fool analysis of Apple’s SEC disclosures.
The company’s board of directors authorized a new $100 billion share buyback program on April 30, 2026, alongside the fiscal second quarter earnings release, matching the prior year’s authorization, according to Apple’s Q2 FY2026 earnings filing.
The board also raised the quarterly dividend 4% to $0.27 per share during that same April 2026 cycle, a yield of roughly 0.31% at current prices that is low in absolute terms but understates the total capital return picture when buybacks are factored in.
The EPS math behind a shrinking share count
The buyback’s most important mechanical effect is its impact on earnings per share (EPS) math, because reducing the share count makes each remaining share represent a larger slice of the same operating income.
Apple’s diluted share count has fallen from roughly 26 billion shares in 2012 to approximately 14.6 billion as of July 2026, a reduction of about 44% over that period.
That means a shareholder who bought stock at the start of Tim Cook’s tenure now owns nearly 80% more of the company per share than they did at the time of purchase, even without buying a single additional share.
In practical terms, Apple’s buyback has functioned as a second earnings growth engine that operates independently of revenue growth and margin expansion.
The fiscal third quarter of 2026 demonstrated the EPS leverage that buybacks create when combined with even modest operational growth.
Revenue grew 16% year over year, but EPS jumped 29% to $2.02, a gap that reflects margin improvement, the shrinking share count, and a one-time $0.11-per-share benefit from tariff refunds working in tandem, according to Apple’s Q3 FY2026 results.
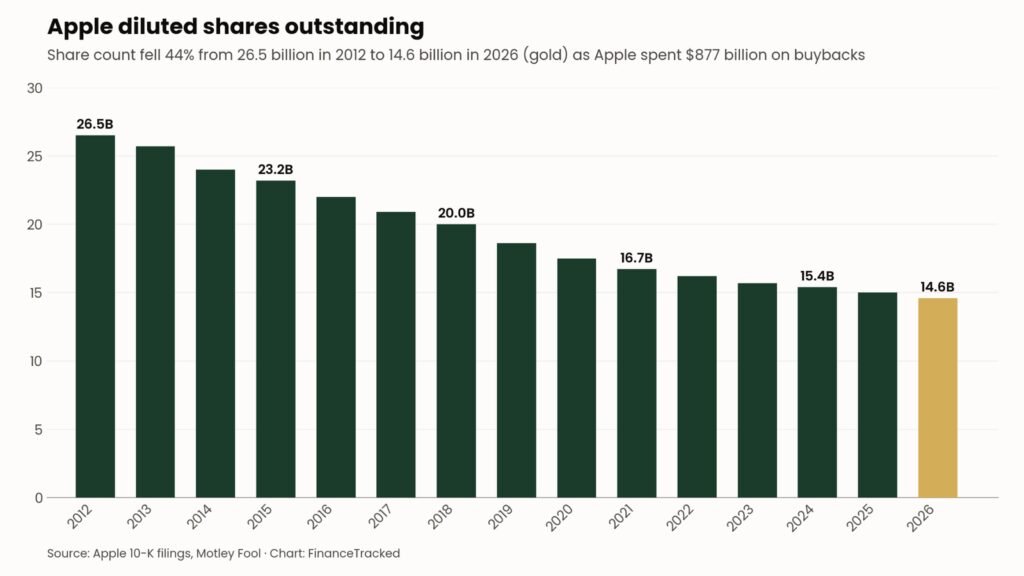
Apple’s buyback program has cut the diluted share count by 44% since 2012, amplifying EPS growth.
How Apple funds the buyback machine
Apple funds its buyback program through operating cash flow, offshore cash repatriation enabled by the 2017 Tax Cuts and Jobs Act, and debt issuance at investment-grade borrowing rates.
The company’s capital structure generated nearly $54 billion in operating cash flow during the first quarter of fiscal 2026 alone and returned almost $32 billion to shareholders in that same period, per Apple’s Q1 FY2026 SEC filing.
Borrowing at low interest rates to retire equity at higher implied earnings yields is accretive to shareholders as long as Apple’s cost of debt remains below its earnings yield, a condition that Apple’s AA+ credit rating and strong free cash flow generation have consistently supported.
Apple held $146.5 billion in cash and marketable securities against $84.3 billion in debt as of the most recent quarter, giving it a net cash position of roughly $62 billion, according to StockAnalysis data.
Margins tell you where Apple’s pricing power actually lives
Apple’s fiscal 2025 gross margin reached 46.9% on a blended basis, but that headline number conceals a structural divergence between the company’s two reporting segments that has been widening for nearly a decade.
Products gross margin came in at 36.8% while Services gross margin reached 75.4%, creating a nearly 39-percentage-point gap between the two, according to Apple’s FY2025 10-K.
Hardware margins have moved only marginally over the past eight years, from roughly 35.7% to 36.8%, because building phones and laptops still requires paying for chips, glass, aluminum, and assembly labor.
Services margins have climbed from approximately 55% in 2017 to above 75% today because the incremental cost of serving one additional subscriber on existing infrastructure is nearly zero.
The Services margin advantage
The mix shift toward Services has steadily driven Apple’s consolidated gross margin higher, from 38.5% in fiscal 2017 to 49.1% across the first nine months of fiscal 2026, according to Statista’s analysis of Apple’s SEC filings.
In the fiscal third quarter of 2026, Apple reported a company-wide gross margin of 50.1%, though the company noted that approximately two percentage points of that figure reflected a one-time benefit from tariff refunds following the U.S. Supreme Court’s ruling on previously implemented tariff policies.
Excluding that benefit, the underlying margin trend still reflects the structural advantage of selling higher-margin services against a growing installed base.
In the fiscal second quarter of 2026, Products gross margin rose to 38.7%, and Services gross margin reached 76.7%, pushing the blended figure to 49.3% without any tariff-refund benefit, according to Apple’s Q2 FY2026 10-Q.
Table 2: Gross margin comparison by segment (source: Apple 10-K filings)
| Metric | FY 2022 | FY 2023 | FY 2024 | FY 2025 |
| Products GM | 36.3% | 36.5% | 36.9% | 36.8% |
| Services GM | 71.7% | 70.8% | 73.9% | 75.4% |
| Blended GM | 43.3% | 44.1% | 46.2% | 46.9% |
Free cash flow and margin risks
Apple’s research and development (R&D) spending relative to revenue remains lower than most mega-cap technology peers, a characteristic that analysts interpret in two opposing ways depending on their investment thesis.
The efficiency reading holds that Apple generates more commercial output per R&D dollar because its product portfolio is deliberately narrow and deeply integrated.
The underinvestment reading argues that the company risks falling behind competitors spending more aggressively on AI infrastructure and cloud computing capabilities.
Free cash flow (FCF) conversion is the margin metric that ties the entire financial system together for investors evaluating Apple’s capital allocation story.
Apple generated $146.7 billion in trailing twelve-month operating cash flow against $10 billion in capital expenditures, producing approximately $136.7 billion in free cash flow, per StockAnalysis data.
That FCF fuels the buyback program and preserves optionality for acquisitions, while the FCF margin itself reflects the compounding benefit of mixing high-margin Services revenue into a stable hardware revenue base.
Apple’s Q3 FY2026 10-Q disclosed that rising costs for components and AI computing resources are expected to intensify and may materially affect revenue, costs, and gross margin going forward, according to the filing.
Additional margin risks include tariff exposure on China-assembled hardware, rising content costs for Apple TV+, and regulatory-driven App Store commission reductions in the EU, each of which maps to a specific line in Apple’s cost structure.
Valuation: what Apple stock prices in today
Apple trades at a trailing price-to-earnings (P/E) ratio of approximately 38.9 and a forward P/E of roughly 33 to 35 as of September 2026, depending on which consensus earnings estimate is used, according to StockAnalysis and GuruFocus valuation data.
Both figures represent a significant premium to Apple’s historical averages, reflecting a market re-rating over the past five years as investors have increasingly valued the company as a platform-and-services hybrid rather than a cyclical hardware manufacturer.
That re-rating has expanded the P/E from the low-to-mid 20s range Apple carried for most of 2015 to 2020 to above 35 in 2026, driven by the recurring revenue characteristics of the Services segment and the margin expansion it has generated.
Apple’s premium relative to peers
The premium roughly matches the broader technology sector median of 38.9, according to analyst data aggregated by Clearank.
The more relevant comparison for Apple is against mega-cap peers like Microsoft, Alphabet, and Amazon, where Apple’s multiple has historically traded at a discount due to its hardware exposure but has converged in recent years as Services revenue has grown.
CLSA raised its Apple price target to $330 in 2026 using a 34 times multiple on projected fiscal 2026 earnings, a 15% premium over Amazon, and noted that analysts expect Apple’s free cash flow to average 108% of earnings from fiscal 2026 through fiscal 2029, according to TradingView’s coverage.
A sum-of-the-parts framework, applying a standalone software-company multiple to Services and a hardware-peer multiple to Products, implies that the market is assigning the majority of Apple’s valuation premium to the Services engine and its recurring revenue characteristics.
Table 3: Valuation snapshot — Apple vs. historical average and S&P 500 (source: StockAnalysis, GuruFocus)
| Metric | Apple (AAPL) | 5-Yr Avg | S&P 500 |
| Trailing P/E | ~38.9× | ~28× | ~24× |
| Forward P/E | ~33–35× | ~25× | ~21× |
| FCF Yield | ~2.6% | ~3.5% | ~4.0% |
| Div. Yield | ~0.31% | ~0.6% | ~1.3% |
Bull and bear case from the sell side
Wall Street’s consensus rating on Apple is a Buy, with 28 analysts covering the stock as of September 2026, and the average price target sits at approximately $334, according to Public.com’s analyst aggregation.
The range spans from a low of $215 to a high of $400, a spread wide enough to reflect genuine disagreement about whether Apple’s current multiple is sustainable at a nearly $5 trillion market capitalization.
Jefferies downgraded Apple to Underperform during this period, citing valuation concerns, while Morgan Stanley maintained an Overweight rating on the strength of Services momentum.
The divergence illustrates a broader debate over whether the compounding system described in this analysis justifies a premium that has expanded well beyond Apple’s own historical norms, or whether the stock has priced in perfection across all six engines at once.
Bottom line
Apple CFO Kevan Parekh framed the company’s financial position during the Q3 FY2026 earnings call by pointing to record operating cash flow, record EPS, and an all-time-high installed base achieved simultaneously across every major product category and geographic segment, according to Apple’s press release.
That convergence of records best illustrates how Apple’s six financial engines operate as a single compounding system rather than a collection of independent line items.
Investors who track only iPhone units during launch quarters or fixate on the P/E ratio in isolation miss the feedback loops that connect a $54.25 billion iPhone quarter to a 75.6% Services gross margin to a 44% reduction in share count over 14 years.
The stock’s current forward P/E of roughly 33 to 35 implies that the market expects this system to keep compounding, and any disruption to one engine would test whether the remaining five can sustain the trajectory alone.