

JPMorgan Chase is the largest bank in the United States by assets, with operations spanning consumer banking, investment banking, payments and wealth management across more than 100 countries.
The second quarter of 2026 brought record profits, a massive capital return program and a Federal Reserve rate hike into the same earnings cycle.
The bank posted its highest quarterly net income ever, raised its dividend, launched a $50 billion buyback authorization and saw its net interest income outlook climb. This analysis explains what each driver means for the stock going forward.
JPMorgan earnings breakdown
Q2 2026 revenue and profit by segment
JPMorgan delivered $58.0 billion in managed revenue in the second quarter, up 27% from the same period a year earlier.
The Commercial and Investment Bank (CIB) was the primary growth engine, generating $24.9 billion in revenue, up 27%, with net profit rising 46% year over year, according to the Q2 2026 earnings press release.
Equity Markets revenue surged 86% to $6.0 billion, while Fixed Income rose 6%, bringing combined Markets revenue to $12.1 billion for the quarter. That figure topped the bank’s prior quarterly trading record set at the start of 2026, according to a Yahoo Finance report.
Investment banking fees climbed 30% to reach their highest level since 2021, and the Payments business delivered $5.3 billion in revenue, up 12%, marking its sixth consecutive record quarter, according to J.P. Morgan Payments.
Table: JPMorgan Q2 2026 Financial Snapshot
| Metric | Q2 2026 |
| Managed Revenue | $58.0 billion |
| Net Revenue | $57.3 billion |
| Net Income | $21.2 billion |
| Reported EPS | $7.70 |
| Adjusted EPS | $6.14 |
| Adjusted ROTCE | 23% |
| CIB Revenue | $24.9 billion (+27% YoY) |
| Markets Revenue (Record) | $12.1 billion |
| Total Expenses | $27.3 billion (+15% YoY) |
Source: JPMorgan Chase Q2 2026 earnings press release, SEC 10-Q filing
Related reading on FinanceTracked:
- AI stocks rallied after the Fed’s first hike since 2023
- Novo Nordisk stock falls as 2026 plan targets peer growth
- Ionis stock eyes royalties up to 20% on Roche drug win
Consumer and Community Banking (CCB) also maintained growth during the quarter, while Asset and Wealth Management (AWM) expanded on client inflows into managed portfolios.
Expenses reached $27.3 billion, up 15% year over year, driven by higher revenue-related compensation, front-office hiring, and volume-related costs across trading and advisory desks.
One-off gains and adjusted earnings
The headline profit figure included several items that will not repeat in future quarters. JPMorgan recognized a $4.6 billion net gain from transactions involving Visa Inc. shares held in its Corporate segment, alongside $1.0 billion in gains on certain equity investments held across Corporate and CIB, according to the company’s 10-Q filing.
Stripping out those items, adjusted net income was $16.9 billion, with adjusted EPS of $6.14 and a return on tangible common equity (ROTCE) of 23%.
The adjusted figure provides a more reliable baseline for modeling future earnings, since the Visa gain in particular reflected a mark-to-market event rather than a recurring revenue stream. Analysts evaluating the bank’s run rate should anchor to the $6.14 adjusted EPS rather than the $7.70 reported figure.
Full-year 2026 earnings outlook
Analyst consensus places full-year 2026 EPS at roughly $24.93, representing a 24.5% increase over the $20.02 reported in fiscal 2025, according to Zacks Investment Research estimates compiled by Yahoo Finance.
For fiscal 2027, earnings are expected to grow more modestly, by roughly 0.3% to approximately $25.02, suggesting the market views 2026 as a cyclical peak in trading and advisory activity.
The first quarter of 2026 had already set a strong pace, with net income of $16.5 billion and EPS of $5.94, according to the company’s Q1 2026 10-Q filing.
The sequential acceleration into Q2 was driven primarily by CIB, where elevated market volatility and a rebound in merger activity created unusually favorable conditions for both trading desks and advisory teams.
Net interest income and the Fed rate effect
How Fed rates flow into JPMorgan’s revenue
Net interest income (NII) represents the spread between what JPMorgan earns on loans, securities and deposits held at the Federal Reserve, minus what it pays depositors and other funding sources.
NII is the bank’s single largest revenue line, and its trajectory depends more on the direction of short-term interest rates than on any other variable in JPMorgan’s business model.
The Federal Reserve raised its target range by 25 basis points to 3.75% to 4.00% on September 16, 2026, prompting major banks to increase their lending rates, according to a Zacks analysis published by Yahoo Finance.
The hike supports yields on JPMorgan’s loan book and other interest-earning assets, providing an incremental lift to NII. At the same time, higher rates force the bank to raise deposit rates to stay competitive, compressing margins on the liability side of the balance sheet.
Updated NII guidance and balance sheet growth
JPMorgan raised its full-year 2026 NII outlook to approximately $105.5 billion, up from the previously targeted $103 billion, after the strong second-quarter results.
NII excluding Markets is now projected at approximately $96.5 billion, compared with the earlier estimate of $95 billion, according to a Zacks analysis.
The upward revision suggests balance sheet growth is offsetting a more pronounced rate-driven headwind than previously expected.
Average loans rose 10% year over year in the second quarter, while average deposits grew 7%, stabilizing NII even as earlier forecasts had assumed rate cuts would weigh on earnings.
Growth in revolving credit card balances and wholesale lending provided additional support, demonstrating that consumer and corporate borrowers remain active despite elevated borrowing costs.
Jamie Dimon, Chairman and Chief Executive Officer (CEO) of JPMorgan Chase, characterized the U.S. economy as displaying notable resilience during the quarter.
Dimon acknowledged the strong operating environment but cautioned against complacency, warning that multiple sources of instability remained beneath the headline numbers.
In his Q2 earnings statement, Dimon said the results reflected a favorable environment, but flagged geopolitical instability, persistent inflation, sovereign debt loads and stretched asset valuations as threats.
The raised NII outlook will not translate dollar-for-dollar into profit expansion, however. JPMorgan also increased its 2026 adjusted expense forecast to approximately $107.5 billion, reflecting higher volume-driven and revenue-related costs.
The net effect is a wider top line paired with rising expenses, keeping profitability strong but limiting the margin improvement investors might otherwise expect from higher rates.
Dividends and the income case
Recent dividend increase and yield
JPMorgan’s Board of Directors raised the quarterly common stock dividend to $1.65 per share from $1.50, effective for the third quarter of 2026, representing a 10% increase, according to the company’s June 24 announcement.
The annualized payout now stands at $6.60 per share. At the stock’s recent trading price near $349, that translates to a dividend yield of approximately 1.9%.
JPMorgan has raised its dividend for 15 to 16 consecutive years, depending on the measurement method, according to Koyfin.
The payout ratio sits at roughly 27%, meaning the bank distributes just over a quarter of its earnings as dividends and retains the rest for reinvestment, buybacks and regulatory capital buffers.
The next ex-dividend date falls on October 6, 2026, with payment scheduled for October 31, 2026.
Capital position behind the payout
JPMorgan’s earnings capacity and capital reserves support the dividend. During the first half of 2026, common dividends declared totaled $8.1 billion, while net income applicable to common equity reached $37.1 billion over the same period, according to a Yahoo Finance analysis of the bank’s capital returns.
Earnings covered the dividend more than four times over during the half, leaving a substantial cushion for future payouts.
Common Equity Tier 1 (CET1) capital stood at $303 billion at the end of June, with the standardized CET1 ratio at approximately 14.2%, well above the 11.5% minimum requirement including regulatory buffers.
The Stress Capital Buffer (SCB) remains at 2.5% through September 2027 following the Federal Reserve’s February 2026 announcement.
The yield is modest relative to some bank peers, but that partly reflects the concentration risk that comes with relying on any single stock for income, a dynamic that applies whether the issuer is a FTSE 100 oil major or America’s largest bank.
Share buybacks and capital allocation
The $50 billion repurchase program
JPMorgan’s Board authorized a new $50 billion common share repurchase program effective July 1, 2026, matching the size of the 2025 authorization, according to the company’s announcement filed with the SEC.
The authorization followed JPMorgan’s clearance of the 2026 Federal Reserve stress test, which determines whether major banks can survive hypothetical economic catastrophes before receiving regulatory approval to increase dividends or expand buybacks.
Two consecutive years of $50 billion authorizations suggest a sustained commitment to share repurchases rather than a one-off capital return event.
Buyback authorizations are ceilings, not obligations, and the timing and volume of purchases remain at management’s discretion.
Still, JPMorgan’s track record of executing these programs aggressively gives investors reason to view the authorization as a credible signal of intent.
Execution pace and shareholder return math
During the first half of 2026, JPMorgan repurchased approximately 49.3 million shares at an average price of roughly $305 per share, spending approximately $15.0 billion in total, according to the company’s 10-Q filing.
The first quarter accounted for $8.3 billion at an average price of $303, while the second quarter added $6.2 billion at an average of $308.
At the first-half pace of roughly $15 billion per six months, the full $50 billion program would take approximately 18 months to exhaust, though buyback execution is rarely linear.
Net treasury stock purchases reduced CET1 capital by $13.8 billion during the half, yet CET1 capital still rose by $14.2 billion over the same period, demonstrating the strength of JPMorgan’s organic capital generation.
Combined shareholder returns through dividends and buybacks totaled approximately $23 billion during the first half of 2026.
Table: JPMorgan Dividend and Capital Return Summary (H1 2026)
| Metric | Value |
| Quarterly Dividend | $1.65 per share |
| Annualized Dividend | $6.60 per share |
| Dividend Yield | ~1.9% |
| Buyback Authorization | $50 billion |
| H1 2026 Buybacks | $15.0 billion (49.3M shares) |
| H1 2026 Dividends Declared | $8.1 billion |
| Total H1 Capital Returns | ~$23 billion |
| CET1 Ratio | 14.2% (vs. 11.5% minimum) |
Source: JPMorgan Chase IR, SEC 10-Q filing, Yahoo Finance
Dimon framed the capital return strategy around what he has long called a fortress balance sheet, stating that JPMorgan’s significant excess capital and robust liquidity enable the firm to consistently serve clients while returning capital to shareholders, according to the June 24 press release.
Whether management is buying back shares at the right price is a separate question, and Warren Buffett’s old rule about being greedy when others are fearful cuts both ways when the buyer is also the issuer.
Valuation: Is JPM stock expensive
Current multiples versus historical range
JPMorgan traded at a trailing price-to-earnings (P/E) ratio of approximately 14.5 to 14.9 as of late September 2026, based on trailing twelve-month EPS of $23.38 and a stock price near $349, according to FullRatio. The forward P/E stood at approximately 13.6 based on consensus 2026 earnings estimates.
The current multiple sits roughly 20% above JPMorgan’s ten-year average P/E of 12.2. Over the past decade, the P/E peaked at 16.84 in the fourth quarter of 2017 and bottomed at 8.65 in the third quarter of 2023.
The price-to-book ratio of approximately 2.5 also exceeds its five-year average of 1.8, while the price-to-tangible-book ratio stands at roughly 3.28, reflecting the market’s confidence in JPMorgan’s franchise value above its accounting equity.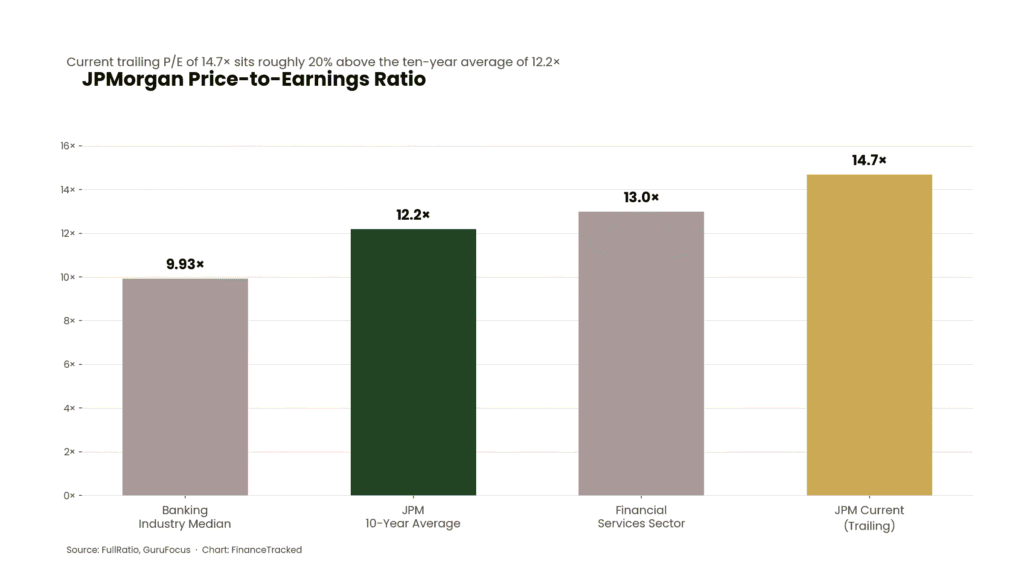
JPMorgan’s current trailing P/E of 14.7× sits 23% above its ten-year average, reflecting both record profitability and elevated expectations.
Sector comparison and fair value estimates
Table: JPMorgan Valuation Multiples vs. Peers
| Multiple | JPMorgan | Sector / Industry |
| Trailing P/E | 14.5–14.9× | Financial Services: ~13.0× |
| Forward P/E | ~13.6× | Banking Median: 9.93× |
| Price-to-Book | ~2.5× | 5-Year Avg: 1.8× |
| Price-to-Tangible Book | ~3.28× | — |
| Price-to-Sales | ~4.51× | Industry Avg: 2.57× |
| FCF Yield | ~9% | — |
Source: FullRatio, GuruFocus, U.S. News
JPMorgan trades at roughly a 15% premium to the Financial Services sector average P/E of about 13, according to GuruFocus.
The price-to-sales ratio of 4.51 runs approximately 76% above the industry average of 2.57. The stock’s free cash flow yield of roughly 9% offers some offset, but the forward P/E of 13.6 still sits 37% above the banking industry median of 9.93.
GuruFocus estimates JPMorgan’s fair value at approximately $308, which places the stock roughly 13.3% above its estimated intrinsic value at recent prices.
Sell-side targets vary widely, with CFRA analyst Kenneth Leon carrying a $375 target and Bank of America at $408, according to U.S. News.
The premium reflects record profitability and a diversified revenue mix, but it also means much of the positive outlook is already priced in.
Recession risk and credit quality
Jamie Dimon’s macro warnings
Dimon has consistently flagged downside risk to the U.S. economy even as JPMorgan’s own results have set records. In his 2026 annual letter to shareholders, Dimon warned of potential stagflation, describing persistent inflation as a scenario that could drive interest rates higher and asset prices lower, according to Fortune.
He cited ongoing wars, including the conflict in Iran and Russia’s invasion of Ukraine, as forces that could tip the economy into recession or worse.
The warnings have continued through 2026. During the Q2 earnings period, Dimon acknowledged the economy’s strength but cautioned that geopolitical instability, persistent inflation, growing sovereign debt and stretched asset valuations were present beneath the surface.
He has also argued that the era of ultra-low interest rates may be permanently over, with the economy settling into a structurally higher-rate environment driven by deficit spending and supply-side constraints.
That stance matters for investors because Dimon’s public commentary tends to move markets, and his willingness to flag risk while reporting record results underscores a tension at the core of the investment case.
The leadership transition unfolding at Berkshire Hathaway, where Buffett recently completed a generational handover, offers a parallel reminder that even the strongest franchises must eventually navigate the departure of their defining leader.
Consumer credit trends and card losses
JPMorgan’s consumer credit metrics improved in the second quarter, offering some reassurance amid recession warnings.
The Card Services net charge-off (NCO) rate fell to 3.34% from 3.47% in the first quarter and 3.40% a year earlier. Management cut its full-year 2026 Card NCO forecast to approximately 3.2%, down from the prior estimate of roughly 3.4%, reflecting better-than-expected consumer credit performance, according to Zacks research compiled by Yahoo Finance.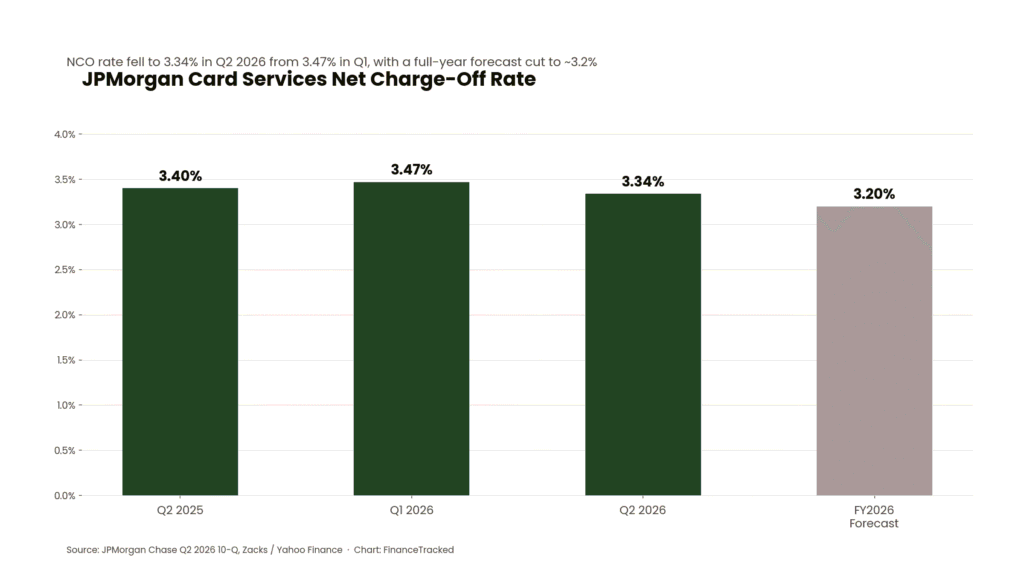
The declining NCO trend and lowered full-year forecast suggest consumer credit quality is stabilizing, though a weaker labor market could reverse the improvement.
Credit costs held steady at $2.5 billion during the second quarter, and delinquencies came in lower than expected across FICO score segments.
Still, Consumer and Community Banking recorded $2.2 billion of net charge-offs in Q2, up $70 million year over year, with Card Services accounting for the bulk of the increase.
A higher-for-longer rate environment keeps borrowing costs elevated for lower-income card borrowers, and management has identified the labor market as the single most important determinant of future consumer credit performance.
CEO succession and strategic direction
Dimon’s timeline and the new leadership bench
Dimon plans to remain CEO of JPMorgan for at least three more years, according to sources familiar with the matter cited by Reuters via U.S. News.
The bank elevated Doug Petno and Troy Rohrbaugh to co-presidents in June 2026, setting up a competitive succession structure that gives the board visibility into the next generation of leadership. Marianne Lake, previously viewed as a top contender for the CEO role, retired.
Daniel Pinto had served as Dimon’s emergency successor and held the president and chief operating officer (COO) role until his retirement in 2026.
Jennifer Piepszak, who replaced Pinto as COO, publicly stated she does not wish to be considered for the CEO position at this time, according to American Banker.
The co-president structure narrows the field and gives the board a defined evaluation window before Dimon’s eventual departure.
Strategic priorities under the current leadership
JPMorgan’s growth investments are expanding well beyond traditional banking. The Chase UK digital banking platform has grown to approximately 2.5 to 3 million customers and recently expanded to Berlin, with the long-term goal of building a pan-European digital bank, according to the Q2 earnings call summary.
Dimon has noted that artificial intelligence (AI) is driving 30% to 40% job reductions in discrete areas of the business, with most affected employees offered positions elsewhere within the firm.
The Payments business continues to serve as a growth engine, having just posted its sixth consecutive record quarter with $5.3 billion in revenue. Meanwhile, the wealth management franchise manages more than $7.7 trillion in client assets.
Management has acknowledged competitive pressure from fintech firms including Stripe, PayPal, Cash App, Chime, SoFi, and Revolut, and views sustained technology investment as a requirement to defend its market position across all segments.
Bottom line
JPMorgan’s earnings engine is diversified and operating near peak performance, but the stock’s premium to its own historical multiples means the margin for disappointment is narrow.
Analysts at CFRA project 20.5% revenue growth for the full year and maintain a $375 price target, while Bank of America’s $408 target implies further upside from current levels, according to U.S. News.
The gap between the two targets reflects genuine uncertainty about whether record trading activity and elevated rate-driven NII can be sustained.
The $50 billion buyback and rising dividend signal management’s confidence in the bank’s capital generation, though tighter regulatory requirements or a credit deterioration could constrain future distributions.
Investors tracking the stock should watch three catalysts most closely: updates to the full-year NII guidance, the direction of Card Services net charge-off rates and the Federal Reserve’s next rate decision.