

Nigeria ranks third in the world on the 2026 Chainalysis Global Crypto Adoption Index, behind Brazil and the United States.
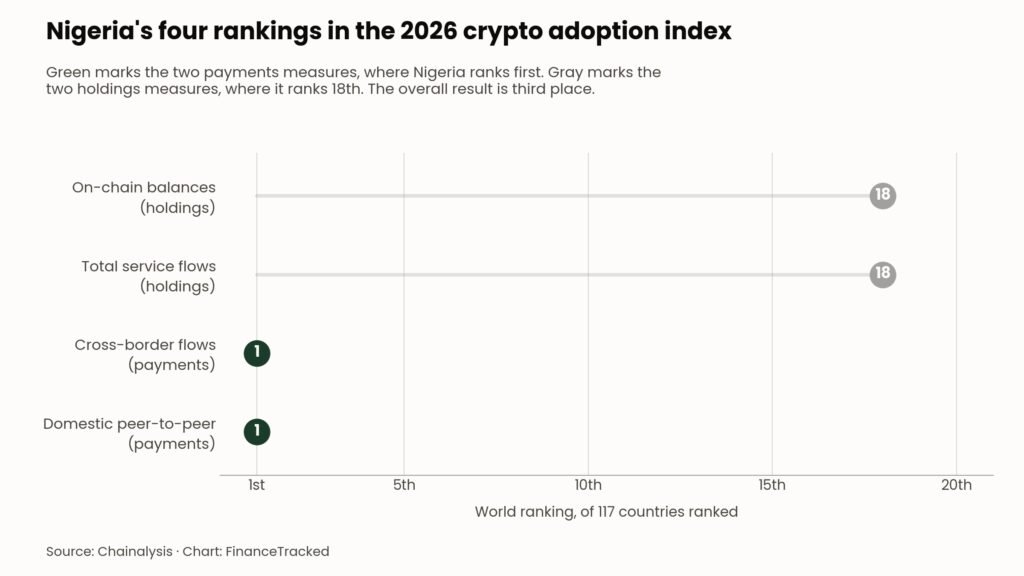
The ranking is built from four separate measures, and Nigeria sits at opposite ends of them. It ranks first globally on both measures that track crypto payments moving between people.
It ranks 18th on both measures that track money sitting still. That split is the whole explanation for third place, and it says more about how Nigerians use these rails than the headline number does.
Nigeria ranks first on both crypto payments measures
Two of the index’s four sub-indexes are flow measures, and they align most closely with crypto payments. Nigeria leads the world on each.
The first is the domestic peer-to-peer economy, meaning value moving directly between personal wallets inside a country. The second is cross-border flows, meaning value crossing a national border.
Globally, domestic peer-to-peer transfers “rose 302.9%, from $56.8 billion to $228.7 billion” over the period, according to Chainalysis. Cross-border stablecoin transfers rose 77.5%, from $124.2 billion to $220.3 billion.
The cross-border figure carries a detail that matters for reading Nigeria’s position. Those transfers average about $3,000 each, a size Chainalysis describes as too small to be institutional.
Stablecoins are 96% of peer-to-peer crypto payments activity
Chainalysis states that peer-to-peer activity “is now 96% stablecoins” globally. That figure applies to the peer-to-peer measure rather than to every ranking in the index.
It suggests Nigeria’s first-place peer-to-peer crypto payments ranking is heavily tied to stablecoin-denominated transfers. Chainalysis does not publish a Nigeria-specific token breakdown.
The contrast inside the data supports that reading. Value flowing into exchanges and other services fell 4.3%, from $9.30 trillion to $8.90 trillion. Stablecoin service inflows rose 5.3% over the same period.
So the parts of the market tied to trading contracted while the parts tied to crypto payments grew. Nigeria ranks first on the growing half. The same pattern shows up in how stablecoin settlement reaches ordinary card spending elsewhere in the market.
The two 18th-place rankings measure holdings, not transfers
The other two sub-indexes look at stock rather than flow.
Total service flows measure value received by exchanges, DeFi protocols and other businesses, weighted by GDP per capita. On-chain balances measure holdings at a point in time. Nigeria ranks 18th on both.
Taken together, those rankings suggest a market where value moves through faster than it accumulates. Chainalysis does not characterize Nigeria that way directly, so the reading is an inference from the ranking profile.
Globally, Chainalysis associates the $3,000 average transfer size with supplier payments, remittances, and moving savings out of a currency users no longer trust. Nigeria’s ranking profile fits those use cases, though no Nigeria-level breakdown is published.
What a flow-heavy, stock-light profile indicates
Taken together, those rankings suggest a market where value moves through faster than it accumulates. Chainalysis does not characterize Nigeria that way directly, so the reading is an inference from the ranking profile.
Globally, Chainalysis associates the $3,000 average transfer size with supplier payments, remittances, and moving savings out of a currency users no longer trust. Nigeria’s ranking profile fits those use cases, though no Nigeria-level breakdown is published.
The cost case is well documented. Remittances into sub-Saharan Africa average about 9% in fees against a global average of 6%, the IMF noted in June.
That gap is part of why dollar-linked transfers took hold while the naira was depreciating.
How the geometric mean turned two extremes into third place
The method explains why two first places do not produce first overall.
Chainalysis ranks 117 countries. It weights the raw values by purchasing power parity, rescales every country onto a common zero-to-one scale, then combines the four scores.
“A country’s overall index score is the geometric mean of its four normalized scores. This method rewards countries that perform consistently across all four measures and prevents dominance in a single category from masking weakness elsewhere.” — Chainalysis, 2026 Global Crypto Adoption Index
A geometric mean punishes an uneven profile. Two scores near the top cannot offset two in the middle, because the measures multiply rather than add.
Brazil took first place without ranking first on any single measure. It placed in the top four on all of them. Nigeria’s crypto payments dominance is sharper, and its overall position is lower.
Key numbers in Nigeria’s crypto payments ranking
- Nigeria ranks 3rd overall, 1st in domestic peer-to-peer, 1st in cross-border flows, 18th in total service flows and 18th in on-chain balances (Chainalysis, September 23, 2026)
- Domestic peer-to-peer transfers rose 302.9% globally, from $56.8 billion to $228.7 billion (Chainalysis)
- Cross-border stablecoin transfers rose 77.5%, from $124.2 billion to $220.3 billion (Chainalysis)
- Cross-border transfers average about $3,000 each (Chainalysis)
- Peer-to-peer activity is 96% stablecoins (Chainalysis)
South Africa ranks ninth on a flatter profile
The regional comparison shows what the method does with a different profile.
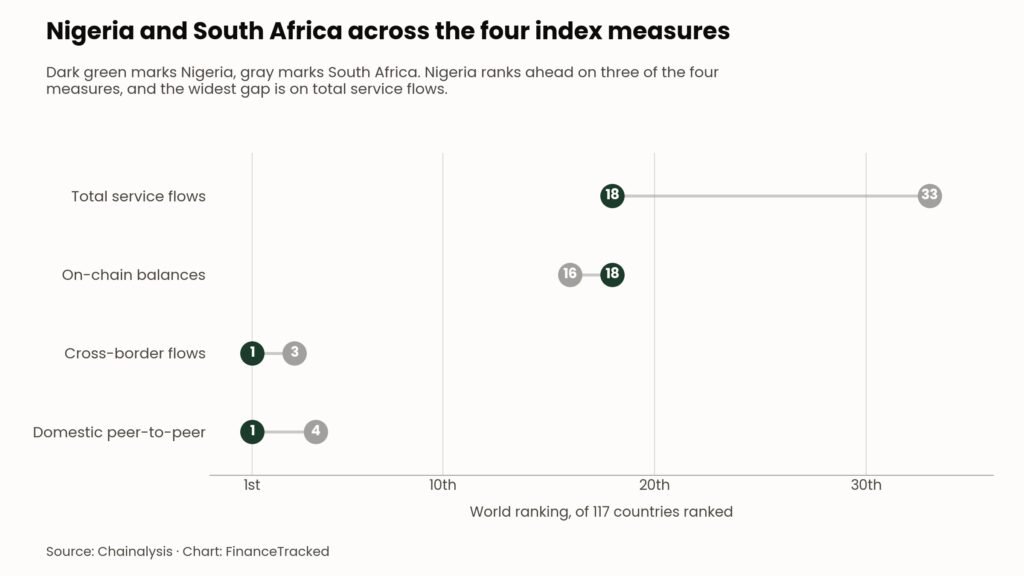
South Africa ranks 9th overall. It places 4th in domestic peer-to-peer, 3rd in cross-border flows, 16th in balances and 33rd in total service flows.
It leads on nothing and trails Nigeria on three of the four measures. Its only advantage is balances, at 16th against Nigeria’s 18th, while the widest gap is total service flows, where it sits 15 places behind.
Nigeria’s crypto payments scores are strong enough on two measures to carry it six places higher despite that.
Sub-Saharan Africa led the world in growth over the period, which Chainalysis attributes to exceptionally strong peer-to-peer activity. The regional picture is one of transfer volume rather than accumulated holdings, and it shapes where African payment infrastructure is being built.
The Sub-Saharan Africa chapter has not been published yet
Chainalysis releases the report in regional chapters rather than all at once. Latin America appeared on September 23, Central and Southeast Asia and Oceania on September 30, and East Asia on October 5.
The Sub-Saharan Africa chapter had not been published as of October 6, 2026. That chapter is where Nigeria’s country-level value figures will appear, which leaves the rankings above as the most specific published data on Nigeria.
What Nigeria’s crypto payments ranking means
Nigeria’s position is a statement about use rather than wealth. The country leads the world at moving dollar-denominated value between people, domestically and across borders, and sits mid-table on what it holds. Read as a payments indicator, the ranking is unambiguous.
Read as a measure of market size, it is misleading, because the index deliberately weights consistency over peaks. Anyone using the number should say which of the four measures they mean, because the four disagree.
Frequently asked questions (FAQs)
Why is Nigeria third rather than first in crypto payments?
The overall score is the geometric mean of four normalized sub-scores. Nigeria’s two 18th-place rankings pull the product down, and no amount of strength on the other two offsets them.
What is the difference between flows and balances?
Flows measure value moving over 12 months. Balances measure value held at a single point in time. A country can move a great deal while holding relatively little.
Which stablecoins drive the activity?
Chainalysis does not break the peer-to-peer figure down by token in the index chapter. It states only that peer-to-peer activity is 96% stablecoins.
What period does the crypto payments ranking cover?
July 1, 2025 to June 30, 2026. The index is published annually, and the rankings reset with each edition.