


KEY TAKEAWAYS
|
Zcash (ZEC) is approaching a critical juncture as price action hovers just below the $500 psychological level. Following a powerful rally that saw the privacy coin surge from July 2024 lows near $16 to a November 2025 peak of $744.13, ZEC has entered a corrective phase, compressing price into a fragile equilibrium between accumulation and distribution.
With volatility compressing and technical indicators sending mixed signals, the current structure reflects a market divided between expectations of continuation and the risk of a deeper correction.
While higher-timeframe patterns hint at potential continuation through an ascending triangle formation, short-term momentum metrics suggest caution. The $500 region now represents both an opportunity for bulls and a risk zone if support fails. This analysis examines the technical underpinnings, on-chain flow dynamics, and probabilistic scenarios for Zcash through the holiday trading period.
Current Market Metrics
| Metric | Value | Significance |
| Current Price | ~$417 – $420 | Testing key support |
| 2025 High | $744.13 (Nov 7, 2025) | ~44% decline from peak |
| Market Cap | ~$6.8B – $6.9B | Top 50 crypto |
| 24H Volume | ~$450M – $750M | Variable participation |
| 30-Day Price Volatility | 21.62% | High volatility regime |
| Fear & Greed Index | 16-24 (Extreme Fear) | Bearish sentiment |
| Shielded Supply | ~4.8M ZEC (30%) | Record privacy adoption |
Ascending Triangle Formation
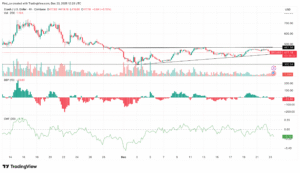
On the daily chart, Zcash’s price appears to be forming an ascending triangle pattern, a technical formation characterized by a series of higher lows converging toward horizontal resistance. The upper boundary of this pattern sits near the $500 level, while the rising support trendline connects the higher lows established since the November correction began. This pattern typically resolves with a breakout in the direction of the prevailing trend, though confirmation requires a decisive close above resistance with volume expansion.
However, recent price action has complicated this bullish structure. ZEC lost the $430 support level on December 23, 2025, triggering approximately $1.65 million in long liquidations according to CoinMarketCap data. Analysts warn that if the double-top pattern completes, the price could decline toward the $370 level. The loss of $430 has invalidated the near-term ascending triangle setup, shifting focus to the $380-$400 zone as the critical demand area. A reclaim of $450 could revive bullish scenarios targeting $500.
Short-Term Momentum Exhaustion
On the 4-hour chart, signs of fatigue are becoming more pronounced. Multiple momentum indicators align on bearish readings:
- Bull Bear Power (BBP): The indicator remains firmly below the zero line, printing expanding red histogram bars around -32.77. This reflects persistent seller dominance and suggests that bulls have yet to regain control despite recent stabilization attempts.
- Chaikin Money Flow (CMF): Currently reading at -0.15, the CMF remains in negative territory, indicating that capital outflows continue to outweigh inflows. This suggests recent upside attempts lack strong volume backing and are vulnerable to distribution rather than follow-through buying.
- Relative Strength Index (RSI): Reading between 40-43 on multiple timeframes, the RSI indicates neutral-to-bearish conditions. Recent attempts to break into the mid-50s have failed, keeping the overall tone on the softer side.
- Moving Averages: The majority of moving averages across short, medium, and long timeframes are pointing down and sitting above the current price. The MACD remains below zero, indicating a lack of upward drive.
Daily Chart: A More Balanced Picture
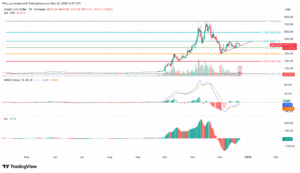
Despite short-term weakness, the daily chart presents a more constructive outlook. Momentum indicators provide tentative support: the MACD remains in positive territory, with the 12-day EMA positioned above the 26-day EMA, although fading green histogram bars suggest momentum is still fragile.
The Awesome Oscillator (AO) also prints consecutive green bars while remaining below zero, hinting at a gradual momentum shift rather than a decisive reversal. ZEC currently trades between the 0.5 and 0.618 Fibonacci retracement levels of its broader rally, a zone that often serves as a decision point for trend continuation or reversal.
Critical Support Levels
- $420-$400: Primary support zone currently being tested. This range corresponds to prior consolidation areas and psychological round numbers. A break below would confirm the descending pattern and accelerate losses.
- $383.53: Key Fibonacci level and structural support. A breakdown below this level would weaken the ascending triangle structure and increase the probability of further downside.
- $350-$370: Extended downside target based on measured move projections if $400 fails. This zone aligns with the double-top completion target flagged by analysts.
- $300: Long-term support tested during December’s correction. A revisit of this level would represent a significant structural breakdown.
Resistance Levels
Near-term resistance has formed at $450, which ZEC must reclaim to preserve the ascending triangle pattern and increase the odds of a breakout toward $500. Above $450, the $468.11 level represents significant Fibonacci resistance.
A successful reclaim of this zone with volume confirmation could drive ZEC toward the $588.54 extended target. The psychological $500 level represents the primary bullish objective, serving as both a prior resistance zone and the upper boundary of the current consolidation pattern. Beyond $500, the $600-$650 region marks the next major supply zone from the November rally.
Capital Outflows Signal Risk Reduction
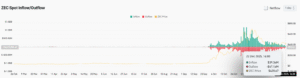
Beyond price action, on-chain data aligns with the bearish short-term narrative. According to Coinglass, ZEC has recorded more than $47.16 million in spot outflows at press time, signaling that capital is actively exiting the market. Sustained outflows of this magnitude often reflect risk reduction rather than accumulation, increasing the likelihood of further consolidation or downside unless sentiment shifts materially.
Shielded Adoption: A Contrarian Signal
Despite the bearish flow data, Zcash’s privacy features continue to see record adoption. Approximately 30% of the total ZEC supply now resides in shielded pools (Orchard and Sapling), representing roughly 4.8 million ZEC worth over $1.85 billion. Shielded transfers quadrupled to 139,844 in November 2025, suggesting institutional interest in privacy infrastructure remains robust even as short-term traders exit positions.
| Privacy Metric | Current Value |
| Total Shielded ZEC | ~4.8M ZEC ($1.85B) |
| Shielded Supply Percentage | ~30% of circulating supply |
| November Shielded Transfers | 139,844 (4x increase) |
| Grayscale ZEC Trust AUM | ~$136M – $200M |
Bullish Catalysts
- November 2025 Halving: Block rewards were cut from 3.125 to 1.5625 ZEC, reducing annual inflation to approximately 4% and creating supply-side pressure.
- Grayscale ETF Filing: Grayscale has filed to convert its Zcash Trust into a spot ETF, potentially opening regulated capital inflows if approved.
- Whale Accumulation: Cypherpunk Technologies acquired 233,644 ZEC (~1.43% of supply) at approximately $291/ZEC, representing a $68M strategic investment.
- Regulatory Shift: SEC’s Crypto Task Force Privacy Roundtable (Dec 15, 2025) framed privacy tech like Zcash’s zk-SNARKs as essential rather than adversarial.
- Network Upgrades: Zebra 3.1.0 node update and Zashi 2.0 wallet enhancements, improving shielded transaction UX.
Bearish Risks
- EU MiCA Regulations: Proposed 2027 privacy coin restrictions could limit European exchange access.
- Exchange Delistings: Bithumb delisted ZEC on December 1 under MiCA 2.0 rules, showing regional regulatory divergence.
- Privacy Coin Sector Weakness: Broader sell-off in privacy coins (Midnight -25%, Monero -4%) creates sector headwinds.
- Thin Liquidity: 81% drop in Korean exchange volume and limited order book depth amplify volatility.
Bullish Scenario: Breakout Toward $500+
If ZEC can reclaim the $450 level with volume confirmation, the ascending triangle pattern would be preserved, greatly increasing the odds of a breakout. Initial targets in this scenario include $468.11 (Fibonacci resistance), followed by the psychological $500 level. A confirmed breakout above $500 with acceptance would open the path toward the $588.54-$600 region. This scenario requires daily chart momentum indicators to turn decisively bullish, broader market stabilization, and continued institutional accumulation.
Bearish Scenario: Breakdown Toward $350
A sustained break below the $420-$400 support zone would confirm the descending pattern and accelerate losses toward the $350 area. This move would confirm that the current consolidation is resolving lower rather than forming a base for continuation. If the trendline support breaks, analyst Ardi suggests expecting a move back down to the critical support range where the Double Top formation would likely complete. In this scenario, traders would look for plays to short the retest of broken support.
Conclusion
Zcash stands at a critical inflection point as competing forces create a fragile equilibrium. Short-term momentum indicators signal exhaustion, with seller dominance confirmed by negative BBP and CMF readings alongside $47 million in spot outflows. However, longer-term structural factors remain constructive: the daily MACD holds in positive territory, shielded adoption has reached record levels, and institutional catalysts like the Grayscale ETF filing and November halving provide fundamental support.
The $420-$400 zone represents the critical battleground for near-term direction. A successful defense and subsequent reclaim of $450 would validate the ascending triangle structure and open the path toward $500. Conversely, a breakdown below $400 would confirm the bearish scenario and target the $350-$370 zone. Until one of these levels breaks decisively, ZEC remains range-bound in a high-volatility environment where position sizing and risk management are paramount.
