


KEY TAKEAWAYS
|
XRP has entered a pronounced corrective phase following its July 2025 all-time high of $3.67. As of December 24, 2025, the token trades near $1.85-$1.90, representing an approximate 50% drawdown from peak valuations.
Multiple technical indicators have converged on bearish signals, including a confirmed death cross formation, descending triangle pattern breakdown, and persistent negative momentum readings.
Despite deteriorating price action, institutional capital continues flowing into XRP exchange-traded funds, creating a notable divergence between structural demand and speculative sentiment. This analysis examines the technical underpinnings of the current market structure and evaluates probabilistic scenarios for the Christmas-New Year trading period.
Current Market Metrics
| Metric | Value | Significance |
| Current Price | $1.85 – $1.90 | 8-month low |
| All-Time High | $3.67 (Jul 18, 2025) | ~50% decline from peak |
| Market Cap | ~$113B – $115B | 5th largest crypto |
| 24H Volume | ~$2.5B – $3.9B | Declining participation |
| Market Dominance | ~3.87% | 90-day low |
| Fear & Greed Index | 24 (Extreme Fear) | Bearish sentiment |
| XRP ETF Inflows (Total) | >$1.2 Billion | Institutional accumulation |
Descending Triangle Formation
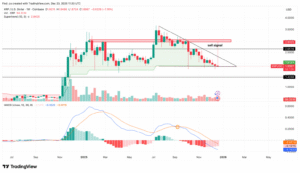
XRP’s weekly chart exhibits a classical descending triangle configuration, characterized by a series of lower highs converging toward horizontal support. This pattern has been developing since the July 2025 peak, with price action compressing into an increasingly narrow range.
The upper trendline connects successive lower highs from approximately $3.65 down through $2.90, $2.50, and most recently $2.20. The horizontal support floor has been tested multiple times near the $1.85-$1.90 zone.
Technical literature classifies descending triangles as continuation patterns within downtrends. The measured move projection, calculated from the triangle’s height applied to the breakdown point, suggests potential downside targets between $1.43 and $1.55 should the $1.85 support fail to hold.
CoinGlass data and Glassnode distribution heatmaps corroborate this analysis, identifying significant supply clusters between $2.38-$2.40 where nearly 3.23 billion XRP were acquired, creating formidable overhead resistance.
Death Cross Configuration
A death cross has been confirmed on the daily timeframe, with the 50-day exponential moving average (EMA) crossing below the 200-day EMA. This formation represents one of the most recognized bearish signals in technical analysis, historically preceding extended drawdown periods. The cross occurred in early November 2025 and has been validated by subsequent price action that has remained below both moving averages.
Historical analysis of XRP’s prior death cross formations reveals mixed outcomes. The February 2024 death cross preceded a bottoming phase near $0.48 before a subsequent 400% rally over four months. However, current market conditions differ materially, with broader macro headwinds including elevated Japanese Government Bond yields threatening yen carry trades and reduced risk appetite across speculative assets. The 10-day EMA now sits at approximately $1.96 and caps price as dynamic resistance, while the 30-day SMA near $2.06 reinforces near-term bearish bias.
Momentum Oscillators
Multiple momentum indicators align on bearish readings:
- Relative Strength Index (RSI): Currently reading between 39-42 on the daily timeframe, indicating neutral-to-bearish conditions without reaching oversold territory. The RSI has formed a bearish divergence against price since the July highs, with indicator readings trending lower even as price attempted rebounds.
- MACD (Moving Average Convergence Divergence): The indicator remains locked in a bearish crossover configuration, with the MACD line positioned below both the signal line and the zero line. Histogram readings show diminishing negative momentum but no signs of bullish reversal.
- Supertrend Indicator: The weekly Supertrend line has flipped red and crossed above price, generating a formal sell signal. This configuration suggests sustained downward pressure until price can reclaim the indicator level.
- On-Balance Volume (OBV): Declining OBV readings indicate net selling pressure and lack of accumulation at current price levels. Volume behavior during recent rebounds shows distribution rather than institutional accumulation.
Critical Support Levels
- $1.85-$1.90: Primary support zone currently being tested. This level has served as a floor through multiple intraday probes in December 2025. Breakdown below would confirm the descending triangle pattern.
- $1.77-$1.80: Secondary support corresponding to the 61.8% Fibonacci retracement of the 2024 low to 2025 high range. April 2025 lows clustered in this area.
- $1.55-$1.63: Extended downside target based on measured move projections and the 78.6% Fibonacci retracement level.
- $0.80: Long-term support based on on-chain cost basis data. A clean loss of $1.77 would expose this considerably thinner demand zone.
Resistance Levels
Near-term resistance has formed at $1.93-$1.95, corresponding to prior support that has now flipped. The 100-hourly SMA provides dynamic resistance, while the $2.00 psychological level represents a significant barrier. Any recovery attempt must reclaim $2.20-$2.30 with conviction to neutralize the bearish structure. The 50-week SMA at $2.32 presents additional overhead pressure, while the 200-day EMA near $2.55-$2.59 marks the threshold for trend reversal confirmation.
XRP ETF Performance: The Divergence Puzzle
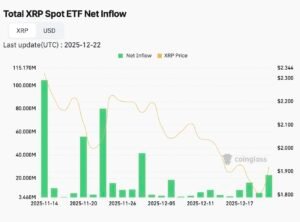
A notable divergence has emerged between XRP’s price action and institutional fund flows. US-listed spot XRP ETFs have maintained a remarkable streak of consecutive positive inflow days, with cumulative inflows exceeding $1.2 billion since product launches. On December 22, 2025 alone, XRP ETFs recorded approximately $43.9 million in net inflows, marking their strongest daily showing in several weeks.
| ETF Provider | Recent Daily Inflow |
| Franklin Templeton (XRPZ) | $8.7 million |
| Bitwise | $7.85 million |
| Canary Capital (XRPC) | $3.62 million |
| Cumulative AUM (All XRP ETFs) | >$1.2 Billion |
This flow-price divergence warrants careful interpretation. Institutional investors appear to be building long-term positions during the correction, treating current prices as an accumulation opportunity rather than a signal to reduce exposure. However, ETF inflows alone have proven insufficient to reverse the bearish price trend, suggesting that structural selling pressure from larger market participants and macro-driven risk rotation outweigh the positive demand signal from regulated investment products.
Supply Distribution
Glassnode data reveals that approximately 52% of circulating XRP supply currently sits in profit, meaning nearly half of all tokens are underwater at present valuations. This represents a significant deterioration from conditions earlier in 2025 when the majority of supply was profitable. Historically, when the share of supply in profit nears or drops below 50%, XRP has tended to enter extended consolidation phases or deeper corrective moves.
Ownership concentration remains elevated. Wallets in the top 1% of XRP holders control approximately 87.6% of total supply, with Ripple Labs maintaining substantial holdings including roughly 45 billion XRP in escrow and approximately 1 billion tokens freely available. This concentration dynamic means that changes in large-holder behavior can rapidly impact price direction. Exchange reserves have declined by approximately 300 million XRP since early October, suggesting some accumulation by long-term holders moving assets to cold storage.
Network Activity
Daily active addresses (DAAs) on the XRP Ledger have declined significantly from the June 2025 peak of 577,000 to approximately 44,000 in recent readings. This substantial reduction in network engagement signals decreased user activity and potentially waning confidence in XRP’s near-term prospects. The muted on-chain activity contrasts with the ETF inflow narrative, suggesting that while institutional products attract capital, retail and on-chain participation has retreated.
Bearish Scenario (Higher Probability)
- Descending triangle breakdown confirms with sustained trading below $1.85
- Price extends toward the $1.55-$1.63 measured move target
- Death cross implications play out with continued lower highs and lower lows
- Thin holiday liquidity amplifies downside volatility
- Macro headwinds persist (elevated JGB yields, Bitcoin ETF rotation)
Bullish Scenario (Lower Probability)
- TD Sequential buy signal triggers reversal from $1.77-$1.78 support
- Sustained ETF inflows translate to spot market demand
- Price reclaims $1.93-$2.00 zone with volume confirmation
- Recovery extends toward $2.20-$2.30 resistance band
- Broader market stabilization supports risk-on rotation
Conclusion
The technical structure surrounding XRP entering the Christmas and New Year period presents a challenging environment for bullish positioning. The confluence of a confirmed death cross, active descending triangle pattern, and sub-50% profitable supply creates meaningful headwinds for price recovery. While institutional ETF inflows provide a constructive longer-term narrative, they have not proven sufficient to arrest the near-term decline.
Critical levels to monitor include the $1.85 immediate support and the $1.77 secondary floor. A decisive breakdown below these thresholds would validate the bearish continuation pattern and open downside toward the $1.55 measured move target. Conversely, any meaningful recovery requires recapturing the $1.93-$2.00 zone with sustained volume to neutralize the prevailing sell bias. Until spot market demand demonstrably returns and key technical resistance levels are cleared, the path of least resistance appears to remain to the downside through the holiday trading period.
